For examples, go to my weather page.
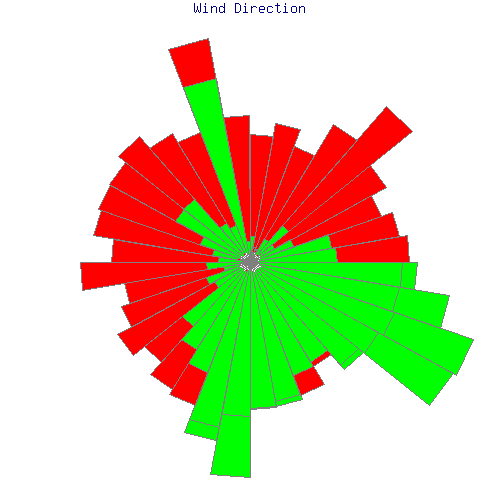
Addon to GDGraph to create Rose Diagrams for displaying wind direction.
Here is what the test routine outputs
Here is a tarball with most of my working code in it, as described below.
Here is an example of the output :
Here is the encoding for the WMR918 :
Protocol for the Oregon Scientific WMR-918 weather station
7/21/2000
Alan K. Jackson (weatherman@ajackson.org)

This document is placed under GPL. Please feel free to use and abuse it, but
give me credit for puzzling it out. Thanks!

Thanks to the creators of the WX200 protocol document. I have tried to follow
their format in preparing this document.

The data stream reacords are directly tied to the sensors themselves, and probably
represent, at least for the most part, the raw data as it is received by the
weather station. Most (all?) quantities calculated by the weather station are not
in fact sent down the RS-232 port.

Records are separated by a 2-byte field of all one's (FFFF).
There are 5 record types. The first byte in each record is the type flag.


Byte   Nibble Bit(s)  Datum   Description 'part' of lo<format<hi unit @ resolution

00. 0  HH     all     Group   00 -------------------------------------------------
00. 1  ??     ???     Wind    ????????? unknown
00. 2  DD     all     Wind    Gust Dir    'bc' of 0<abc<359 degrees @ 1
00. 3  xD     all     Wind    Gust Dir     'a' of 0<abc<359 degrees @ 1
00. 3  Dx     all     Wind    Gust Speed   'c' of 0<ab.c<56 m/s @ 0.2
00. 4  DD     all     Wind    Gust Speed  'ab' of 0<ab.c<56 m/s @ 0.2
00. 5  DD     all     Wind    Avg Speed   'bc' of 0<ab.c<56 m/s @ 0.2
00. 6  xD     all     Wind    Avg Speed    'a' of 0<ab.c<56 m/s @ 0.2
00. 6  Bx      3      Wind    Sign of wind chill, 1 = negative
00. 7  DD     all     Wind    Wind chill  'ab' of -85<ab<60 deg C @ 1
00. 8  HH     all     Cksum   unsigned sum of first 8 bytes +2

01. 0  HH     all     Group   01 ------------------------------------------------
01. 1  ??     ???     Rain    ????????? unknown
01. 2  DD     all     Rain    Rate:       'bc' of 0<abc<999 mm/hr @ 1
01. 3  xD     all     Rain    Rate:        'a' of 0<abc<999 mm/hr @ 1
01. 3  Dx     all     Rain    Bucket tips since ?
01. 4  DD     all     Rain    Total:      'cd' of 0<abcd<9999 mm @ 1
01. 5  DD     all     Rain    Total:      'ab' of 0<abcd<9999 mm @ 1
01. 6  DD     all     Rain    Yesterday:  'cd' of 0<abcd<9999 mm @ 1
01. 7  DD     all     Rain    Yesterday:  'ab' of 0<abcd<9999 mm @ 1
01. 8  DD     all     Rain    Total Reset: Minutes
01. 9  DD     all     Rain    Total Reset: Hours (0<aa<24)
01.10  DD     all     Rain    Total Reset: Day
01.11  DD     all     Rain    Total Reset: Month
01.12  DD     all     Rain    Total Reset: Year
01.13  HH     all     Cksum   unsigned sum of first 13 bytes +2

03. 0  HH     all     Group   03 ------------------------------------------------
03. 1  ??     ???     Outdoor ????????? unknown
03. 2  DD     all     Outdoor Temp        'bc' of -50<ab.c<70 deg C @ 0.1
03. 3  xD     all     Outdoor Temp         'a' of -50<ab.c<70 deg C @ 0.1
03. 3  Bx      3      Outdoor Temp        sign bit. + if 0, - if 1
03. 4  DD     all     Outdoor Humidity    'ab' of 2<ab<98 % RH @ 1.0
03. 5  DD     all     Outdoor Dewpoint    'ab' of 0<ab<56 deg C @ 1.0
03. 6  HH     all     Cksum   unsigned sum of first 6 bytes +2

05. 0  HH     all     Group   05 ------------------------------------------------
05. 1  ??     ???     Indoor  ????????? unknown
05. 2  DD     all     Indoor  Temp        'bc' of -50<ab.c<70 deg C @ 0.1
05. 3  xD     all     Indoor  Temp         'a' of -50<ab.c<70 deg C @ 0.1
05. 3  Bx      3      Indoor  Temp        sign bit. + if 0, - if 1
05. 4  DD     all     Indoor  Humidity    'ab' of 2<ab<98 % RH @ 1.0
05. 5  DD     all     Indoor  Dewpoint    'ab' of 0<ab<47 deg C @ 1.0
05. 6  HH     all     Indoor  Barom P     'ab' of 795<ab+cde<1050 mb @ 1.0
05. 7  xB     1,2     Forecast: C=Sunny, 6=Partly Sunny, 2=Cloudy, 3=Rain
05. 7  ?x     ???     unknown
05. 8  Dx     all     Indoor  Barom P      'c' of 795<ab+cde<1050 mb @ 1.0
05. 8  x?     all     Indoor  Barom P     unknown
05. 9  DD     all     Indoor  Barom P     'de' of 795<ab+cde<1050 mb @ 1.0
03.10  HH     all     Cksum   unsigned sum of first 10 bytes +2

0E. 0  HH     all     Group   0E ------------------------------------------------
0E. 1  DD     all     Time    Minutes field from time display
0E. 2  HH     all     Cksum   unsigned sum of first 2 bytes -2

0F. 0  HH     all     Group   0F ------------------------------------------------
0F. 1  DD     all     Date    ??????????? unknown
0F. 2  DD     all     Date    Hour        'ab' of 0<ab<23 hours @ 1
0F. 3  DD     all     Date    Month       'ab' of 1<ab<12 months @ 1
0F. 4  DD     all     Date    Day         'ab' of 1<ab<31 days @ 1
0F. 5  DD     all     Date    Year        'ab' of 0<ab<99 Year @ 1
0F. 6  HH     all     Cksum   unsigned sum of first 2 bytes -2

Note: c and bb of barometric pressure get revised by sealevel adjustments.

=============================================================================

Nibble Column :
  D -> 4 bit decimal number Range 0-9
  H -> 4 bit hex number Range 0-15
  B -> Bit encoded value
  x -> not defined in this entry

Bits column :
  Bits within defined Nibbles
  0 - Lo order
  3 - Hi order

All data sent in units shown and is independent of the units selected.
Data sent 9600 baud, 8n1.

Cksum :
Last byte in each group is a checksum of that group. It is calculated by performimg
an unsigned add of all the bytes in the group including the group number, excluding
the checksum itself, and subtracting 2 from the result. The checksum is the low order
byte of the sum.

The date field (0F) only gets sent if the chime is set 'on' on the base unit.


Credits :

	I had gotten about 90% of the decoding done when I found John Stanley's
	webpage with his decoding and software. I have incorporated a few things
	that John worked out, but have left mine in where we disagree. John Covert
	also posted a note decoding the Forecast byte.
This set of tools has evolved, rather than been designed, and it probably shows. It is a fairly complex system, but seems to work and be fairly robust.
Input :
Input (for me) comes from a WMR918 weather station. I run "weather_clean -p" in a window, and it traps all the output and logs it into archive files. I generally have to restart it only when power goes away, and when the clocks get reset for daylight savings.
weather_clean uses Weather::Archive to manage the archival files, Weather::Conversions to do units conversions to my chosen units (imperial), and weather_wmr918.pl to do the raw data conversion off the serial port. The structure is peculiar to try to maintain compatibility with MisterHouse. You could, in principle, plug weather_wmr918.pl into MisterHouse and use it to watch over your weather data. Someday I'll set things up so that both the archiving and MisterHouse get the data at the same time.
serial port ---> weather_clean <---> weather_wmr918.pl
                               <---> Weather::Conversions
                               ---> Weather::Archive ---> archxxxxxxxxxxx
The next step is to do some processing of the raw data, and create a daily summary and cleaned up file.
I look for spikes and remove them, interpolate/average all the measurements to 10 minute intervals, and fix problems like the rain total being reset to zero.
archive file (archxxxxxxxxx) ---> Pack_weather.pl <---> Weather::ReadArch;
                                                  <---> Weather::Math
                                                  ---> pack_4-16-2001
ReadArch just reads the archive file (of course). Most of the real work is in Weather::Math. That is where I do spike detection, interpolation, and the vector functions required for dealing with the wind vectors. Output is a nice daily summary like this :
## date 4/16/2001
## input file arch987483621
## rainfall
14:35  0.040
15:05  0.040
15:15  0.080
15:25  0.110
17:05  0.040
17:15  0.040
17:25  0.400
17:35  0.070
17:45  0.120
18:05  0.040
23:25  0.100
## extrema data
TO =  83.8 at 12:35 and  67.5 at 22:18
TI =  72.9 at 19:11 and  70.3 at 14:03
HO =  95.0 at 23:51 and  59.0 at 12:41
HI =  78.0 at 13:12 and  65.0 at 21:23
DO =  73.4 at 14:42 and  59.0 at 15:10
DI =  64.4 at 12:34 and  59.0 at 20:59
BR =  30.0 at 22:22 and  29.9 at 23:59
Heat =  87.2 at 12:10 and  80.3 at 10:00
WC =  84.2 at 12:07 and  64.4 at 15:21
## other data
## begin time 00:05
## Time TO  TI  HO  HI  DO  DI  WC Heat BR gust_dir gust_speed avg_dir avg_speed
00:05  76.43 -999.00 -999.00 -999.00 -999.00 -999.00 76.43 -999.00 -999.00   78.0    0.0   78.0    0
.0
00:15  76.11 70.73 76.53 70.00 69.51 60.80 76.11 76.11 29.90   78.0    0.0   78.0    0.0
00:25  75.74 70.79 77.24 70.00 69.80 60.80 75.74 75.74 29.91   78.0    0.0   78.0    0.0
00:35  75.70 70.70 78.00 70.00 68.00 60.80 75.70 75.70 29.91   78.0    0.0   78.0    0.0
00:45  75.70 70.89 78.00 70.19 68.00 60.80 75.70 75.70 29.89   78.0    0.0   78.0    0.0
00:55  75.65 70.74 78.65 70.00 68.00 60.80 75.65 75.65 29.89   78.0    0.0   78.0    0.0
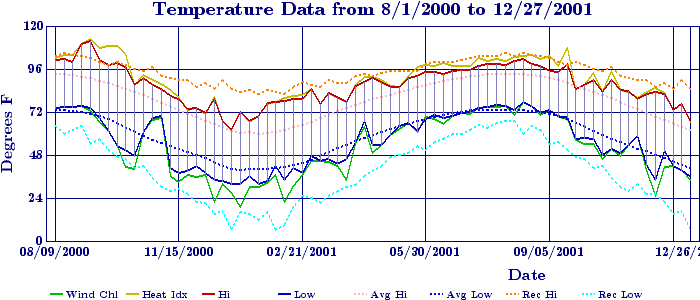
After all that, I'd like to look at the data and see what it looks like. I have several scripts that collect the data from pack files, and using GD::Graph, create plots. These scripts are all similar :
input pack_xx_xx_xxx ---> Temp_plots.pl <---> Weather::ReadPack;
                                        <---> Weather::Climate
                                        <---> GD::Graph::mixed
                                        ---> Temperature.png
                                        ---> tmaxmin (text file of extrema)
Weather::Climate contains the local climatological norms and supplies them to the plotting program. The numbers all pertain to Houston, Texas.
The main plotting programs are :
All of them have some hardcoded paths that would need to be altered.
To drive all of these from a cron, I have some scripts that run these, gather the outputs, and build web pages.
Make_weather_page - yesterday's weather
Make_weather_past - several days of past weather
Finally, to mirror the web pages out onto my website, I run weex on a cron.
There is also a utility Edit_packfiles.pl that can be used to set chunks of measurements in the pack files to undefined. This is good when your batteries die and you record garbage for a few days. 8-)