Crime Analysis for the Heights, Houston, Texas

I have spent some time analyzing the data and also developing an interactive tool so that others may easily test their own ideas. I have tried to document that work here.

Analysis of the data

Is crime increasing, decreasing, about the same? Where is most of the crime occurring? Is crime correlated with population, or with unemployment? All of these questions and more will be investigated.
If you are so inclined, I have some online interactive analysis tools available.
Source code for the analysis is also included.

Image

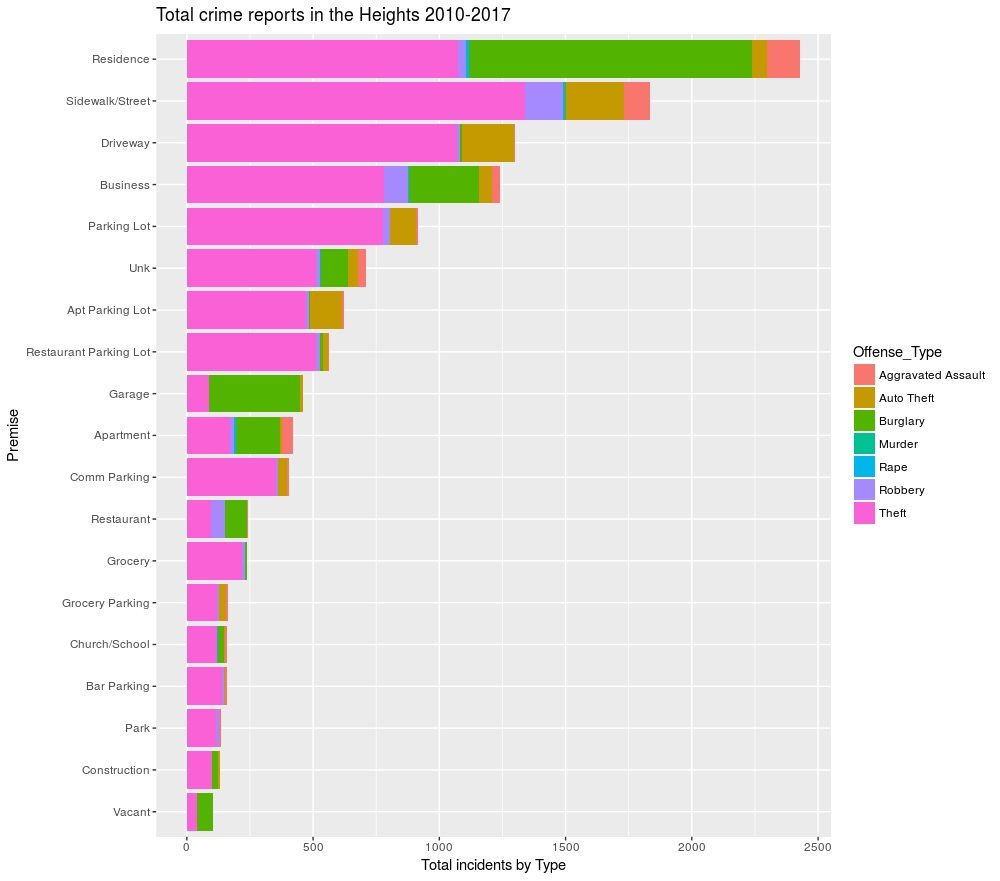
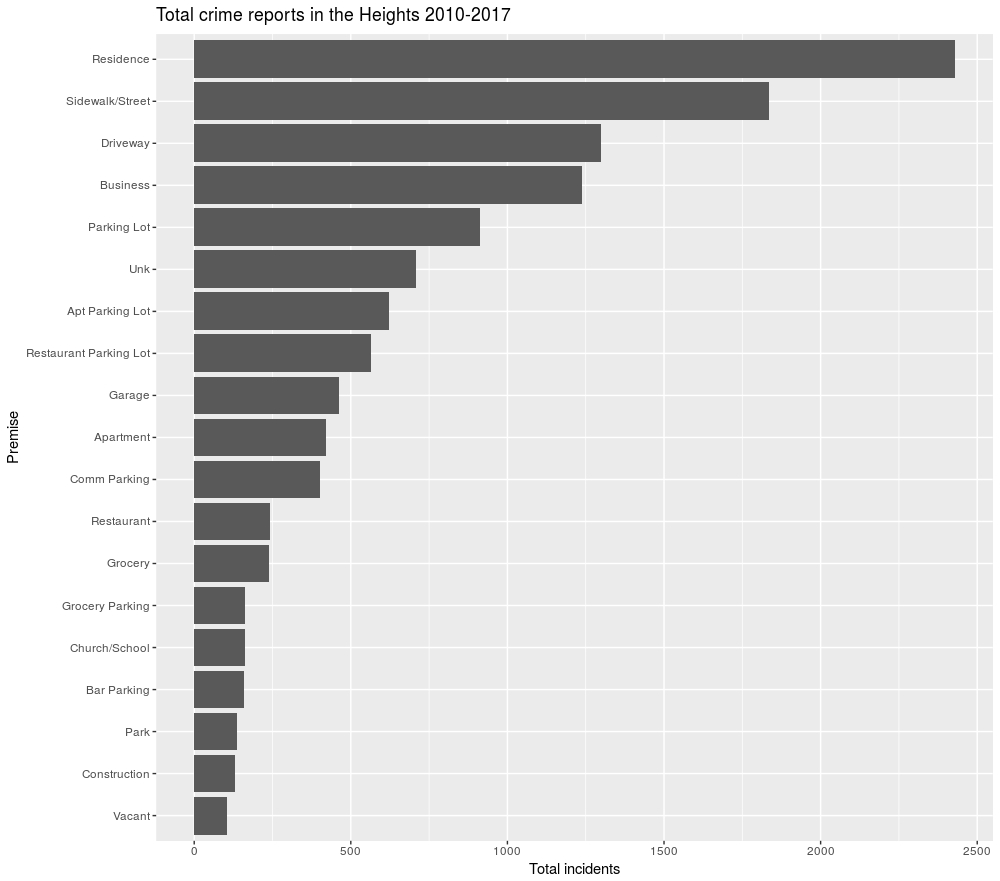
Where did crime occur?

The data contains a "Premise" field, which describes at what sort of place the crime took place. I have also created a shortened list of Premises, largely by consolidating the low frequency items, for ease of analysis.

Frequency data for the original premise set is best seen in a table.


Image

Incidents by Premise

Since Burglary, by definition, requires some sort of breaking and entering, that crime is largely seen in residences, garages, and places of business. I suspect that the large theft numbers for sidewalks, driveways, and various types of parking lots largely reflect theft of things from automobiles - don't leave stuff in your cars! Presumably the residential theft is primarily stealing stuff off the porch, backyard, etc. Like packages.

Image

Residential Incidents

Let's take a look at Residential incidents only. Not really any strong patterns in the monthly data. Perhaps February is a low month - bad weather? And December is a high month - is the theft package theft? Let's examine that more closely in the next plot.


Image

Holiday Season Crime

So in this case we look at the number of incidents in the months of November and December for 6 years. If package theft is a big contributor, then the increase in package deliveries over that span should be reflected in the theft statistics. To me it looks like an overwhelming maybe. Theft was essentially flat until 2016 when it showed a significant increase. But then the year to year variation in burglary is huge, so it may be a statistical artifact. Perhaps thieves are now stealing packages instead of other things, so that the overall rate is about the same. Or maybe it is a real effect.


Image

Time of Day

How is crime affected by the time of day? Everybody knows that you need to be extra careful at night, and indeed, robbery is more likely in the wee hours. Thieves, on the other hand, seem to keep lazy hours - sleep until noon and steal until eleven. Burglary is primarily during hours when no one is at home, especially mid-morning. Probably the evening burglaries are mostly businesses after closing.


Image

Day of Week

Everybody likes to take the weekend off - even thieves and burglars. There does seem to be a slight increase in aggravated assault on Sunday's - domestic violence perhaps? But for property crimes, Sunday is clearly a day off, and Saturday is also down. Perhaps the party hearty effect.


Image

Month of the Year

So theft is way down in February and March. And November. Early in the year is that due to bad weather? Or maybe they got caught and incarcerated for December thefts? But November? And even December? A mystery. I would say that for other crimes, the dependence on month seems to be very small if non-existent.


About the author

Alan Jackson is a retired geophysicist, with time to learn some new skills and do stuff that may benefit the neighborhood.