Beat 2A30 of the Houston Police Department
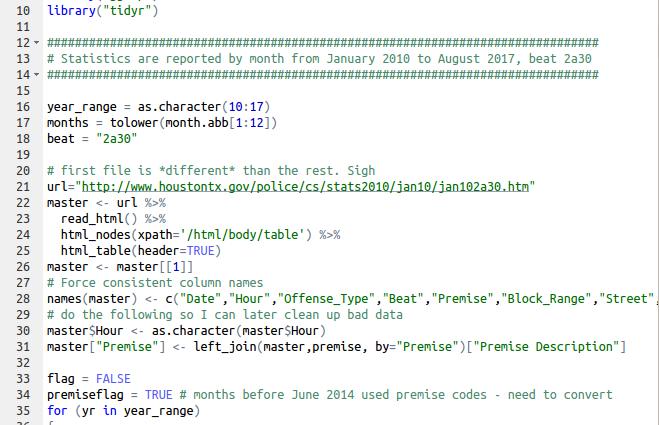
The Beat 2A30 data is found in tables by month starting in January 2010. The format of the tables and the form of the content has undergone several changes. I have tried to take these into account.
This is where you may access the basic data that has gone into my analysis.
Much effort was spent cleaning up the data, which suffered from multiple issues. After cleanup, the data, where possible, was geocoded so that GIS and mapping operations may be performed.
The Beat 2A30 data is found in tables by month starting in January 2010. The format of the tables and the form of the content has undergone several changes. I have tried to take these into account.
library("ggplot2")
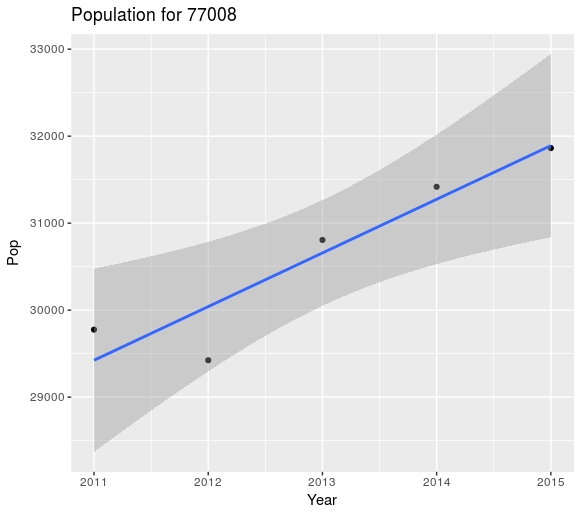
Year = c(2011, 2012, 2013, 2014, 2015)
Pop = c(29776, 29424, 30807, 31418, 31863)
census = data.frame(Year, Pop)
ggplot(census, aes(x=Year, y=Pop)) +
geom_point() +
geom_smooth(method="lm", aes(output=fit<<-..y..)) +
labs(title="Population for 77008")
lm(formula=Pop~Year, data=census)
Coefficients:
(Intercept) Year
-1210960.8 616.8
As can be seen, the population in the area grew by about 2% per year, data from the US census.
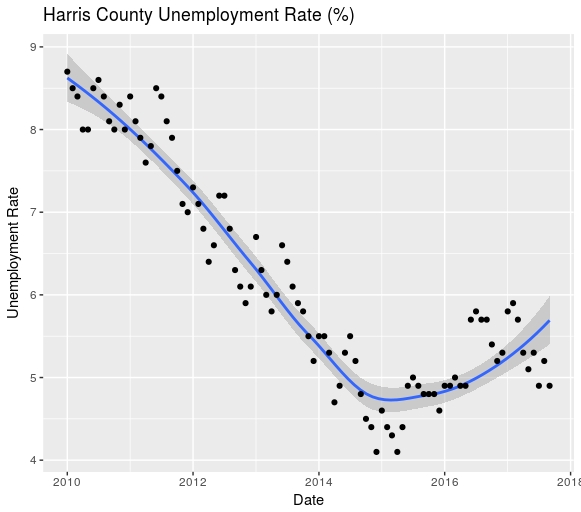
The Unemployment data from the Federal Reserve is also a factor that may be used to adjust the data
Alan Jackson is a retired geophysicist, with time to learn some new skills and do stuff that may benefit the neighborhood.
Copyright © 2017 Adelie Resources, LLC